Technique F13:Failure of Success Criteria 1.1.1, 1.3.3, and 1.4.1 due to having a chart that conveys information by color, instructions that only refer to color, and a text alternative that does not include information that is conveyed by color differences in the image
About this Technique
This technique relates to:
- 1.1.1 Non-text Content (Failure)
- 1.3.3 Sensory Characteristics (Failure)
- 1.4.1 Use of Color (Failure)
This failure applies to all technologies.
Failure techniques show examples of how content can fail particular WCAG success criteria. However, content may still satisfy those criteria if it includes equivalent/alternative content or functionality that does meet the normative requirements. See About WCAG Techniques.
Description
The objective of this technique is to describe the combined failures that occur when an image uses color differences to convey information, when the text alternative for the image does not convey that information, and instructions intended to aid the understanding of the image only identify key parts of the image by their sensory characteristic. These related failures can cause problems for various groups of people – including people who are blind, have low vision, or have color vision deficiency – because they will not be able to perceive the information.
Example
A bar chart of sales data is provided as an image. The chart includes yearly sales figures for four employees in the Sales Department.
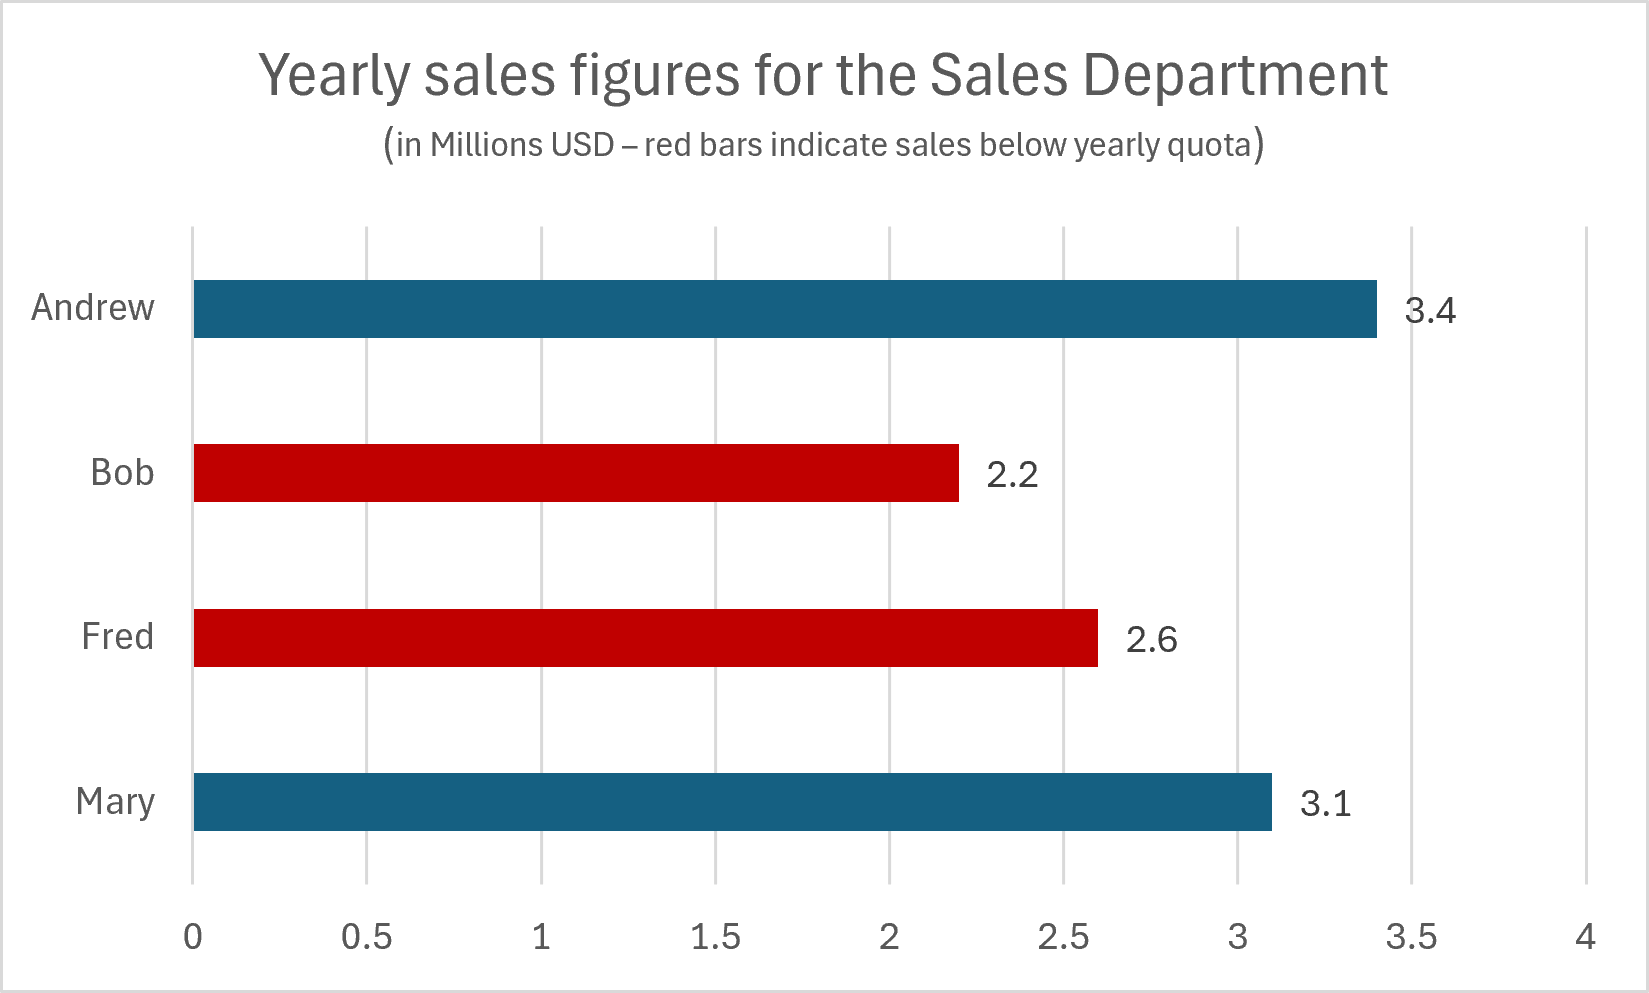
Figure 1. Example chart image for this failure. What the text alternative doesn't say is that Bob and Fred's bars are red, meaning that they didn't reach the yearly quota.
The text alternative for the image says:
A bar chart displaying the yearly sales figures for
         the Sales Department. Mary sold 3.1 Million; Fred, 2.6 Million;
         Bob, 2.2 Million; and Andrew, 3.4 Million. The red bars indicate sales
         that were below the yearly quota.
This text alternative fails to provide the information which is conveyed by the color red in the image. The alternative should indicate which people did not meet the sales quota, instead of describing the use of color. This fails 1.1.1 Non-text Content.
The explanatory text/instructions provided for the chart (red bars indicate
sales below yearly quota
) relies on the user's ability to identify colors.
This fails 1.3.3 Sensory Characteristics.
As the chart relies on color to convey information visually, it fails for sighted users that struggle to identify colors. This fails 1.4.1 Use of Color.
Tests
Procedure
For all images in the content that convey information:
- Check that the information is not conveyed solely by color or color differences.
- Check that instructions provided for understanding the information don't rely solely on sensory characteristics (such as shape or color).
- Check that the text alternative for the image conveys the actual information, rather than only describing the color difference.
Expected Results
- If #1 is false, then the content fails 1.4.1 Use of Color.
- If #2 is false, then the content fails 1.3.3 Sensory Characteristics.
- If #3 is false, then the content fails 1.1.1 Non-text Content.